Digitize your Sample Collection Process with ProTube™ Analytix
Inpeco’s ProTube™ Software Platform enables full control of the pre-pre-analytical phase
Inpeco offers cutting-edge automation solutions both for the pre-pre-analytical steps before (with ProTube™) and the analytical steps inside the clinical laboratory (with FlexLab™), enabling increased productivity and full sample traceability from the collection point to the final test results.
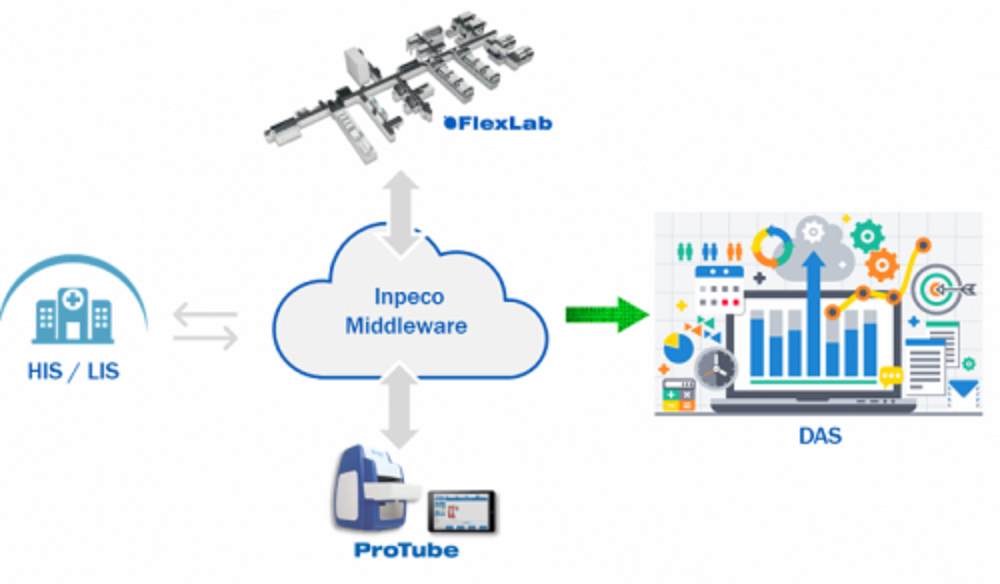
Inpeco’s DAS (Data Analytics System) ensures the collection of all relevant data along the patient journey, from medical prescription to patient results, for full governance of the diagnostic process. The powerful software platform processes and parses data in real time to monitor the full workflow and provide insightful dashboards, graphs and KPIs, regarding both FlexLab™ and ProTube™. Gathering reliable data throughout the entire process is of paramount importance to generate trustworthy results.
Evidence from medical literature says that 62% of all diagnostic errors occur during the pre-analytical phase*. Mistakes like incorrect tube filling (13%), wrong patient identification (9%), or using inappropriate containers (8%) have a big impact on clinical outcomes, potentially causing misdiagnosis or inappropriate treatments for patients and higher costs for the lab. Consequently, the accuracy of clinical test results is greatly influenced by the quality of the incoming samples.
The ProTube™ Suite, Inpeco’s smart solution for the collection point, guarantees the veracity of the data from the beginning of the process and “lab ready” samples of impeccable quality. It assures positive patient identification, verifies the right match between patient and tube, applies perfect tube labels in front of the patient, and ensures the optimal order of blood draw.
All information related to the pre-analytical phase is securely managed by ProTube™ Analytix, part of the DAS solution, which transforms data into valuable insights for predictive analytics and process optimization.
Examples of dashboards and KPIs
Different key stakeholders (Phlebotomist, the Lab Director, the Quality Manager, or the Finance Manager) can visualize the data available in ProTube™ Analytix from various perspectives as per their needs. The available data can also be analyzed using filters such as patient ID, order number, sample ID, or phlebotomist ID. ProTube™ Analytix offers various KPIs and dashboards, some of which are given as examples.
1. Sample collection monitoring – by time and location
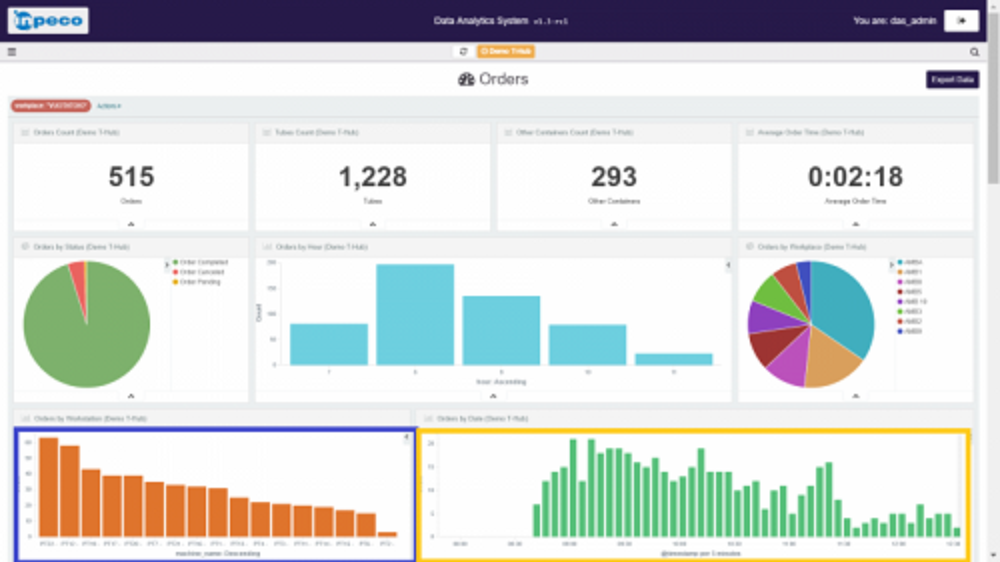
Feature: This KPI shows the distribution of the specimen collection process by location over time.It indicates the number of patients treated and the number of samples collected by the different workstations, during a given time frame defined by the user (day / week/ month/year)
Benefit: Helps to identify potential workload peaks, in order to optimize resource allocation and improve overall efficiency.
2. Sample collection monitoring – by type
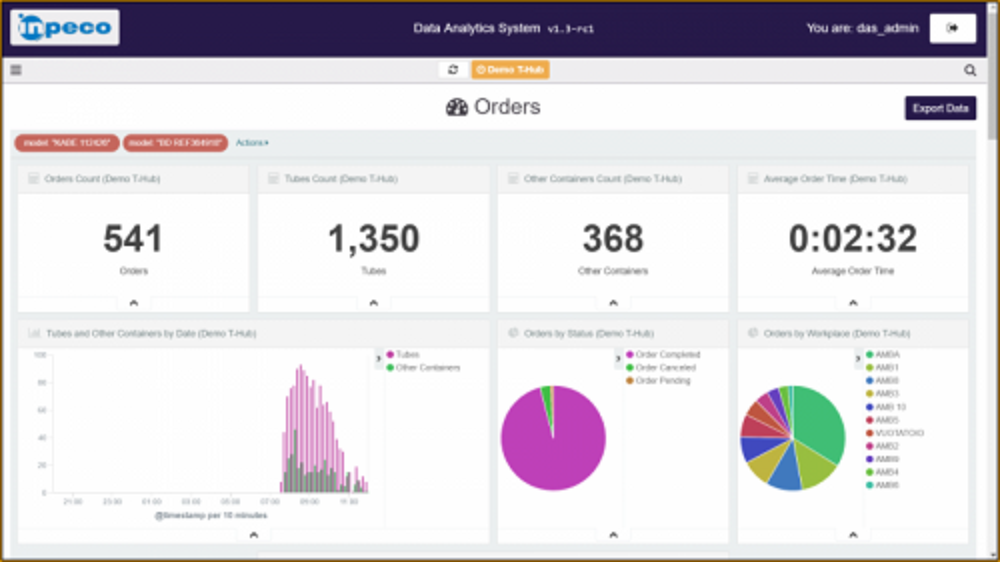
Feature: this KPI looks at the number of sample collections by specimen type (blood, urine and others), reporting also the total number of tubes and containers used.
Benefit: Enables the Collection Manager to dynamically organize collection point logistics, for example deciding on the workstations’ opening and closure times.
3. Order status monitoring
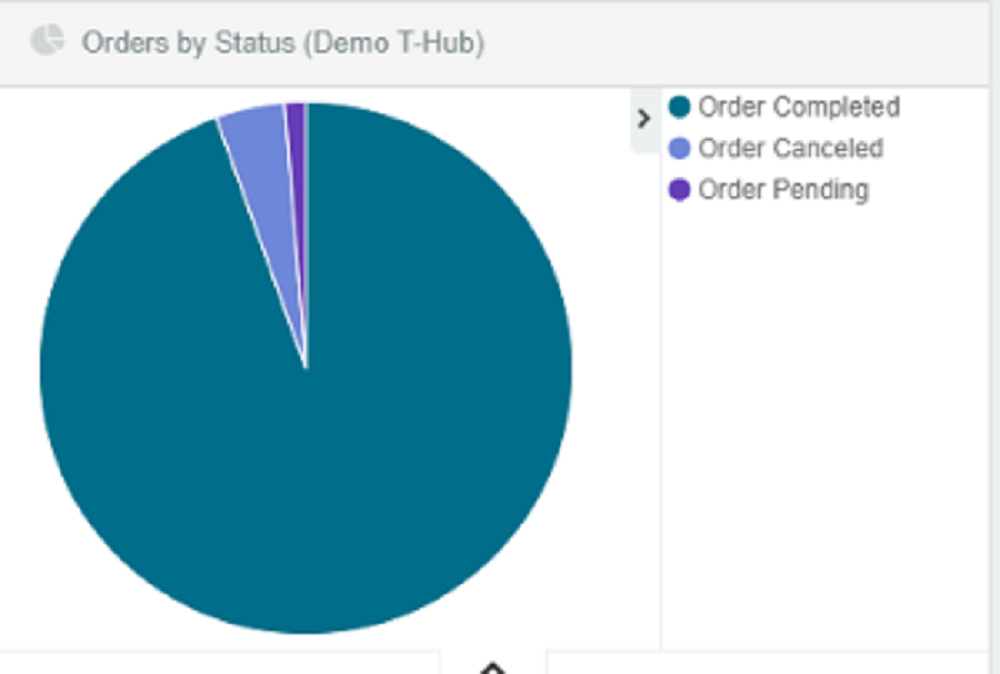
Feature: this KPI indicates the status of each patient’s orders (Completed, Cancelled, Pending).
Benefit: Informs the clinical laboratory in advance about the workload coming from the various collection points, which makes it easier to guarantee smooth and efficient sample processing.
4. Single patient history
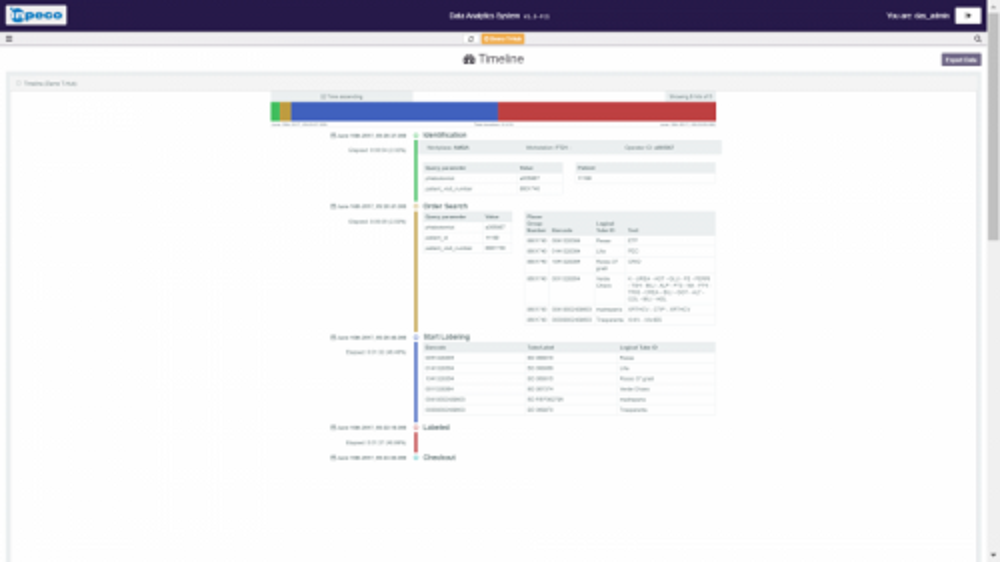
Feature: This timeline shows the pre-analytical history of every patient, from patient identification (check-in) to sample check-out. This dashboard includes traceability data such as the total sample collection time, phlebotomist ID, workstation/location, number and type of samples, as well as the sampling time.
Benefit: A single consolidated dashboard provides access to all events related to a patient for easy tracking. This is in compliance with quality standards such as the Medical Laboratory Accreditation ISO 15189:2012.
5. Number of non-conformities
Feature: The system detects the number of non-conformities during the collection process. For example the mismatch between tube and patient, based on cap colour and tube length recognition.
Benefit: The system clearly identifies and tracks all pre-analytical steps. As each phlebotomist logs in before the process starts, it is possible to trace exactly who did what and when. Monitoring this KPI helps to spot irregularities and plan corrective actions, such as a specific training courses for certain phlebotomists.
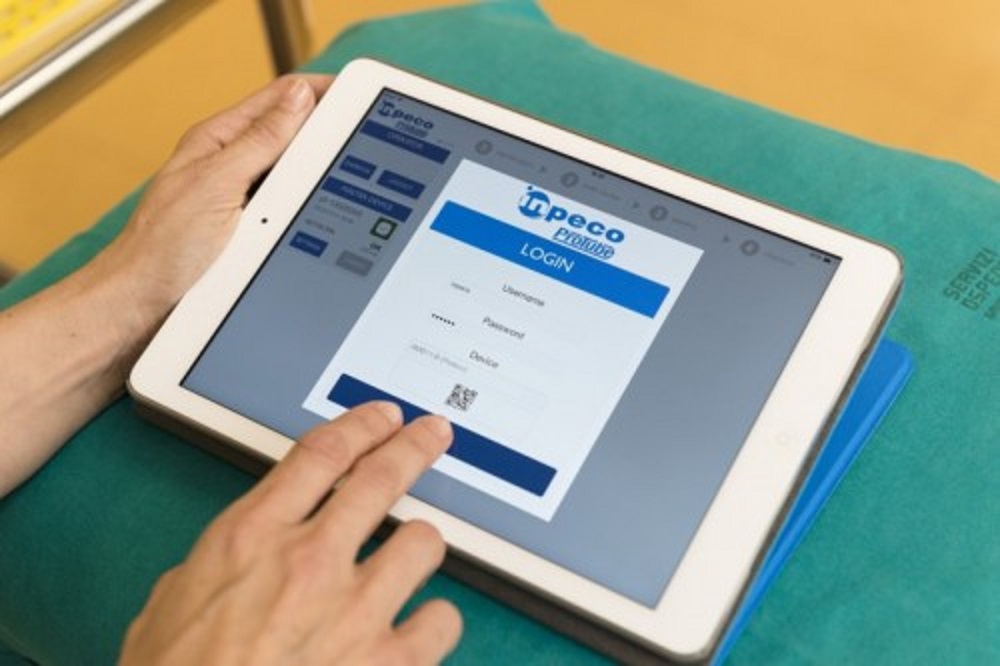
The ProTube™ Analytix brings traceability and ownership to the collection process through digitization. Constantly keeping all pre-analytical phase steps under control leads to higher lab productivity, less human errors, and increased patient safety.
If you are interested in learning more, please contact our experts.
*Paolo Carraro, Mario Plebani, “Clinical Chemistry, Errors in stat laboratory – Types and frequency 10 years later”, Oxford University Press 1/7/2007


